How to replace Google Analytics 4 with Countnest (run both for a week, then switch)
- Edit access to your site's <head>, your Google Tag Manager container or WordPress admin rights
- About 30 minutes of hands-on work, spread over a week of side-by-side running
Which page do you need?
- Still deciding which tool? Read Google Analytics alternatives: 10 tools compared by price, privacy and AI traffic.
- Not sure you should leave GA4 at all? Read When to replace Google Analytics 4.
- Ready to switch to Countnest? This guide is the practical part: every click, in order, with a week of both tools running side by side.
Three definitions
- Google Analytics 4 (GA4) is Google's free web and app analytics service. On 19 November 2026, W3Techs reported Google Analytics on 46.1% of all websites, an 80.9% share of the sites that use a traffic analysis tool it monitors.
- Countnest is a paid, EU-hosted web analytics service from IDCPH ApS in Copenhagen. It counts visits without saving IP addresses and without storing anything on visitors' devices, and adds AI traffic by assistant and Google and Bing search data.
- Side-by-side run means both scripts on the same pages for a while, so you can check the new tool against the old one before you remove anything.
What you can bring over, and what you can't
- Your GA4 history stays in GA4. Countnest has no importer for Google Analytics data (or any other tool's), so Countnest's reports start on the day you add the script.
- Standard GA4 reports are not cut by the retention setting. Google's data retention page says GA4 keeps user-level and event-level data for 2 or 14 months on standard properties (26, 38 and 50 months are for Analytics 360 only), and that this setting only affects explorations and funnel reports, not standard aggregated reports. So your normal reports stay readable for as long as you keep the property.
- Reports export to CSV, PDF or Google Sheets. Google says a downloaded CSV or Sheets file holds up to 100,000 rows. Explorations can be exported too, and the Analytics Data API and Looker Studio are other routes.
- BigQuery export only runs from the day you link it. Google describes data starting to flow within 24 hours of linking, then a daily file with the previous day's data. Standard properties have a daily export limit of 1 million events, and the free BigQuery sandbox has its own limits. If you want raw events, link it during your side-by-side week.
- What you rebuild in minutes: key events (as Countnest goals), UTM-tagged campaigns (your tagged links keep working), the Search Console connection, teammates and a weekly email report.
- What has no Countnest equivalent: GA4 explorations, audiences, Google Ads bidding signals, BigQuery export, user-level reports and age, gender and interest data. If you depend on those, keep GA4, or keep both.
Part 1: prepare in GA4 (10 minutes)
Step 1: Write down what you actually use
Open GA4 and list the reports you look at every week, for example Reports snapshot, Realtime, Traffic acquisition, Pages and screens and your key events. Also note your Google Ads and Search Console links, any audiences, and any events you send with
gtag('event', ...). The table further down shows where each one lives in Countnest.Step 2: Export the reports you want to keep
For each report, set the date range (for example the last 12 or 14 full months), click Share this report in the top right, choose Download File and pick Download CSV, Download PDF or Export to Google Sheets. You need the Viewer role on the property. Google says CSV and Sheets files hold up to 100,000 rows, so split very large reports by date. Do not remove the GA4 tag yet.
Part 2: add Countnest next to GA4 (5 minutes)
Step 3: Create your Countnest account
Open the signup page. It is titled Start your 30-day free trial. Fill in Company or site name, Email and Password (at least 8 characters), tick the box to agree to the Terms and the Data Processing Agreement, and click Create account. No card is asked for, and the trial includes Growth plan features.
Step 4: Add your site
You land on a short setup with three steps: 1. Add your site, 2. Paste the snippet and 3. See your first visit. In the Add a site card, type a Name and your Domain (use
*.example.comto include subdomains), then click Add site.Step 5: Paste the snippet next to your Google tag
Countnest now shows a card called Paste this in the <head> of every page with your personal snippet:
<script defer src="https://countnest.com/c.js" data-site="YOUR-SITE-ID"></script>Put it in your site's
<head>, right next to the GA4 Google tag (the gtag.js block with your Measurement ID, which starts withG-). Both can run on the same page while you compare. We suggest adding the Countnest line directly to your site rather than through Google Tag Manager, so you can remove Google Tag Manager completely later if GA4 was its only job. If your site runs on WordPress, Next.js, Cloudflare or another server, click Full install (WordPress, Next.js, Cloudflare…) and pick your platform under What is your site built on?. More in the install docs.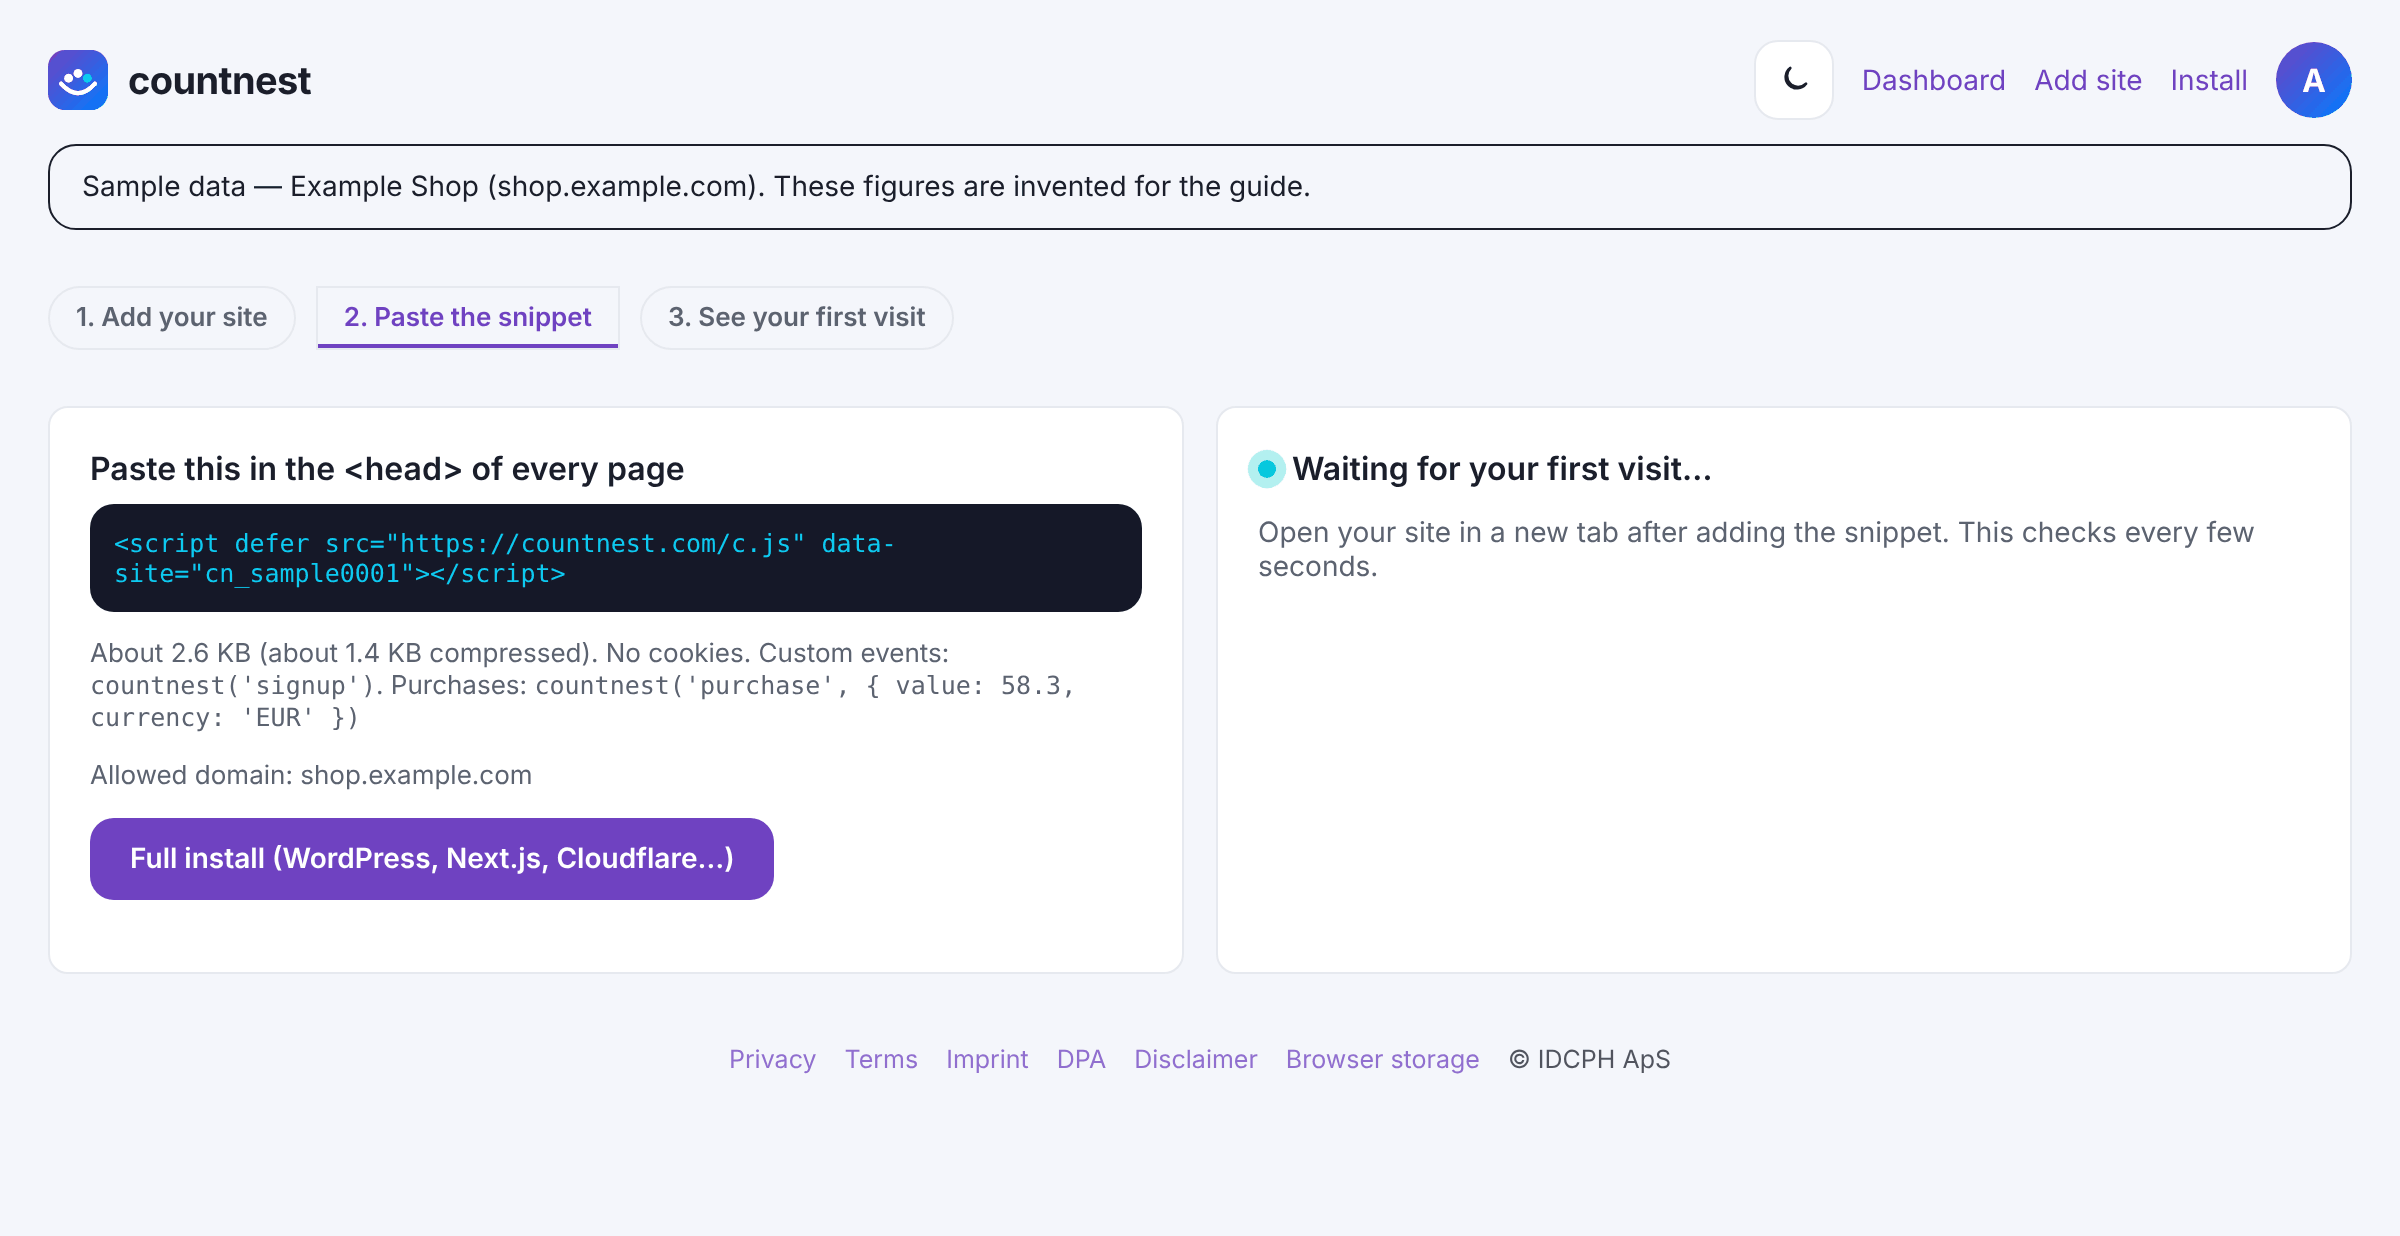
Sample data in the Countnest dashboard (light theme). Step 6: Check that the first visit arrives
Open your site in a new browser tab. Back in Countnest, the card Waiting for your first visit… checks every few seconds and changes to ✅ First visit received. Click Open dashboard. You can run Check installation on the Install page at any time. Countnest does not count browsers that send Do Not Track or Global Privacy Control, so if your test visit does not show up, try another browser.
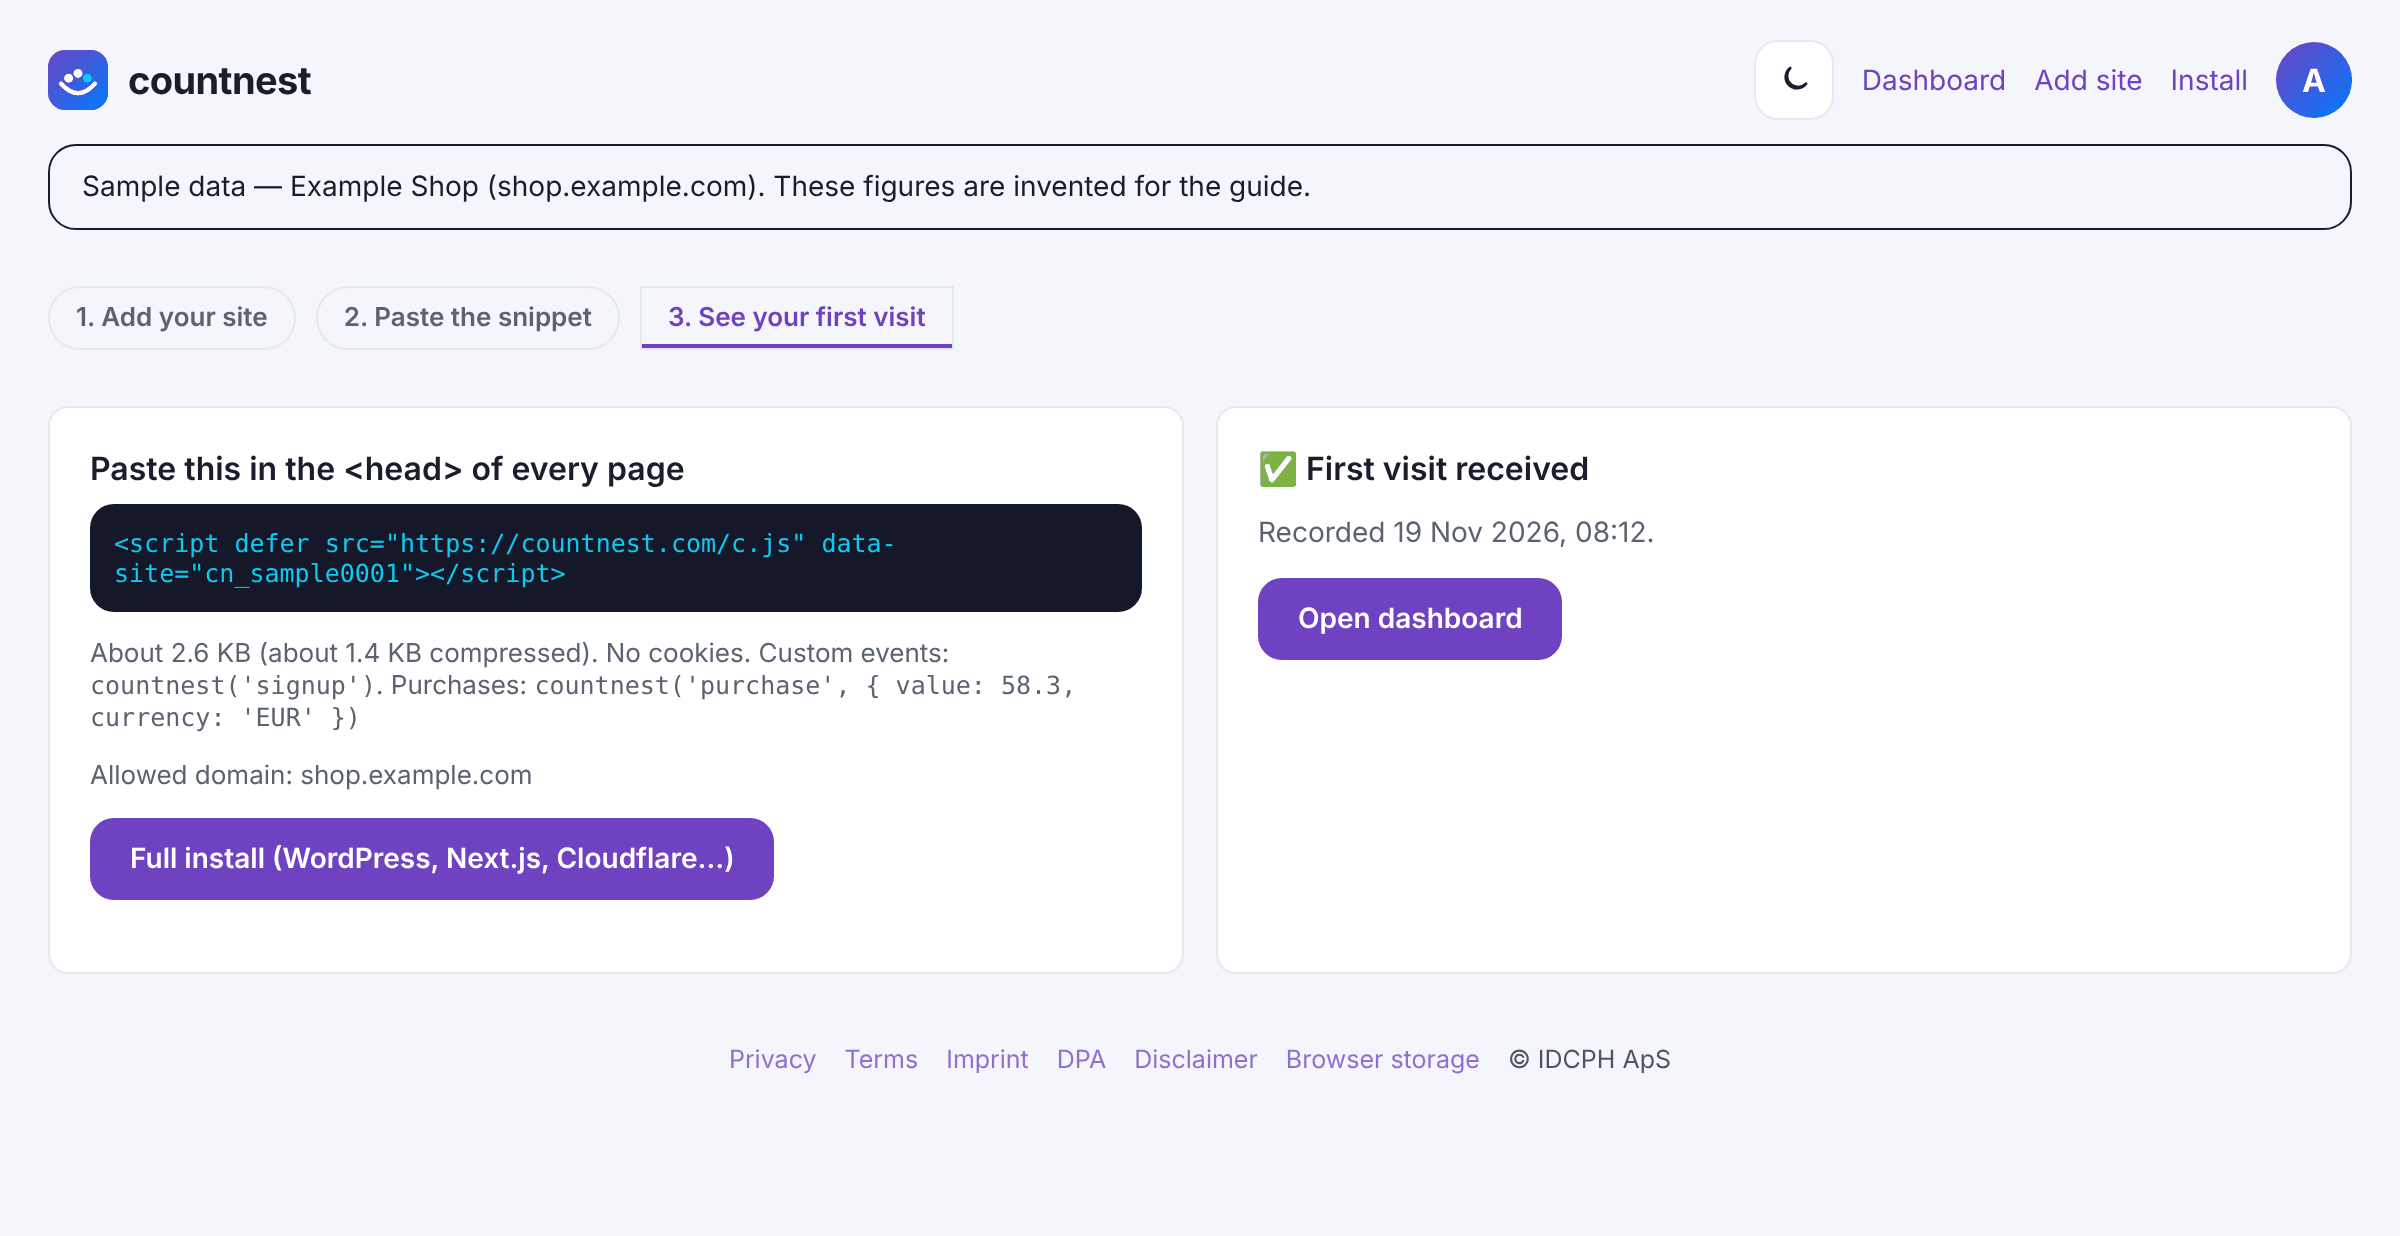
Sample data in the Countnest dashboard (light theme).


Part 3: rebuild your key events and links (5 minutes)
Step 7: Turn GA4 key events into Countnest goals
Open Goals & events and use the form under Goals: type a Goal name, pick a Goal type (Event name, Page path, Scroll depth or Form submission), fill in the match, for example
/thank-youor/blog/*, and click Add goal. A thank-you page key event becomes a Page path goal. A key event you send from code becomes an Event name goal: next togtag('event', 'sign_up'), addcountnest('sign_up')and usesign_upas the match. Outbound link clicks, file downloads and form submissions are recorded automatically, like GA4's enhanced measurement, with no extra code.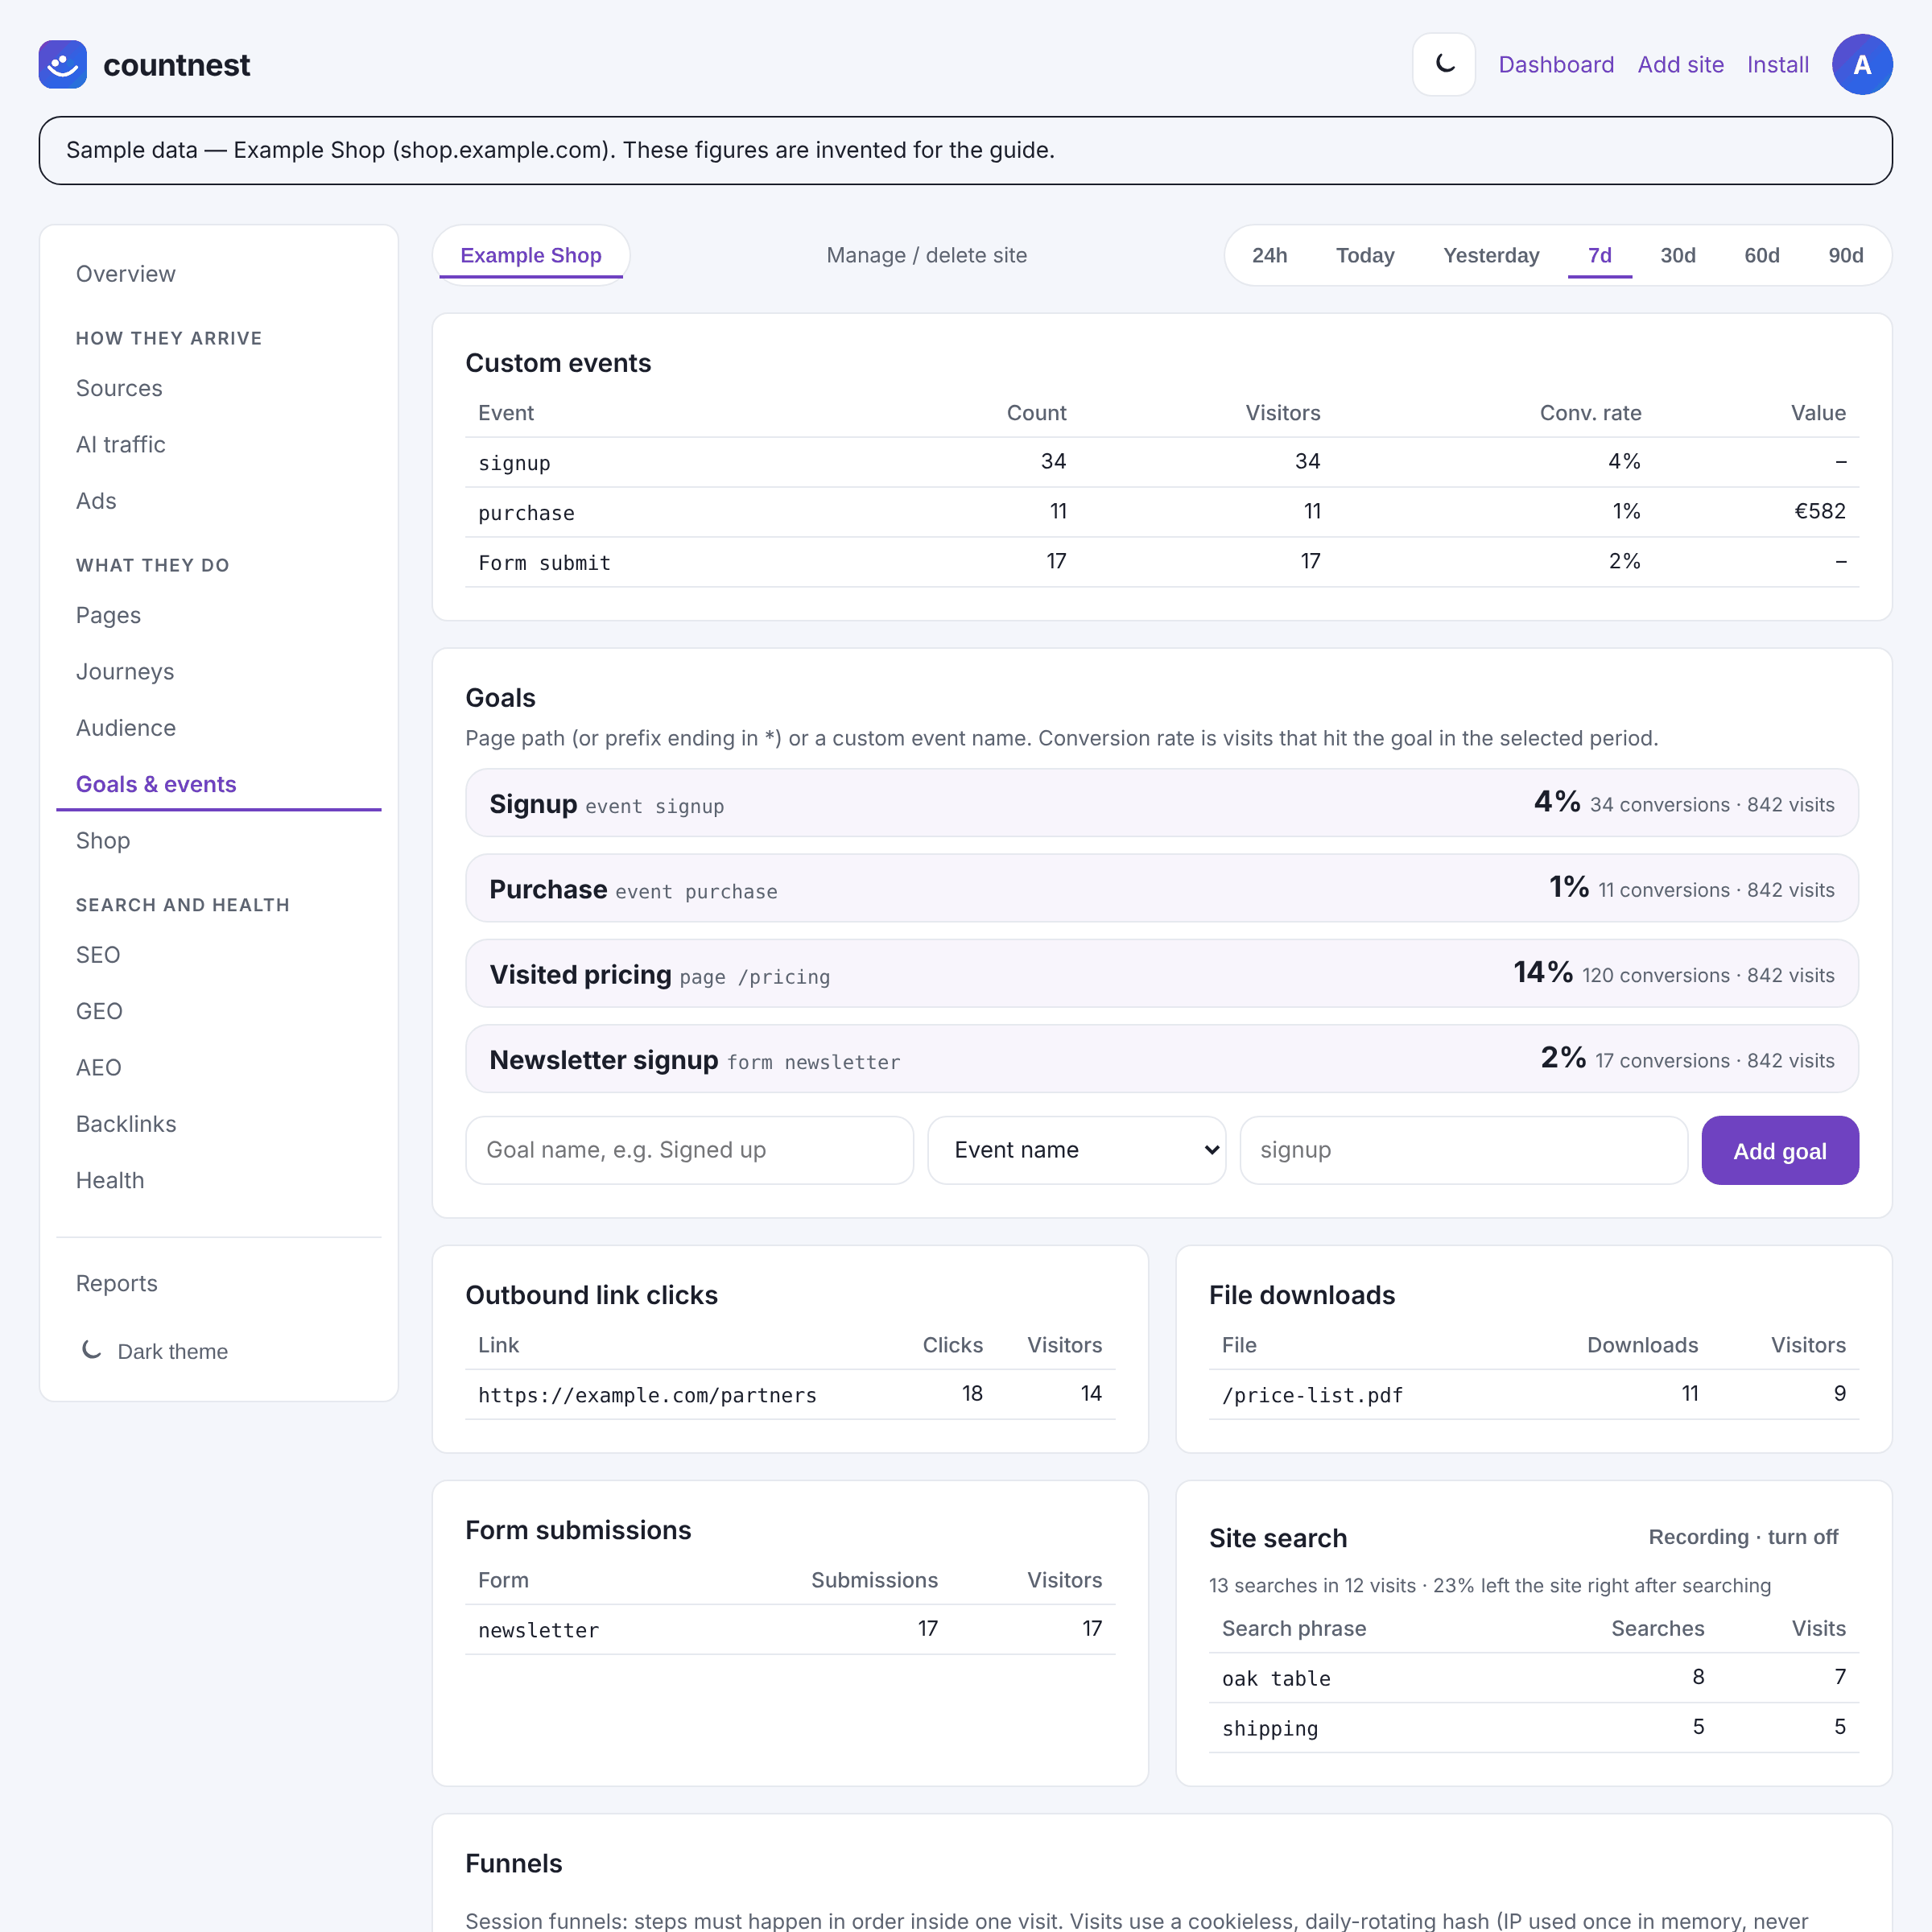
Sample data in the Countnest dashboard (light theme). Step 8: Connect Search Console and keep your UTM links
Open the SEO tab and click Connect Google Search Console, sign in with Google (read-only access) and pick your property. Google's data is about 3 days behind, and Countnest fills in up to 16 months of history over the next nights. Bing Webmaster Tools connects in the same tab. Your existing UTM-tagged links keep working: campaigns appear under Sources in UTM campaigns. For new links, use the free UTM link builder.
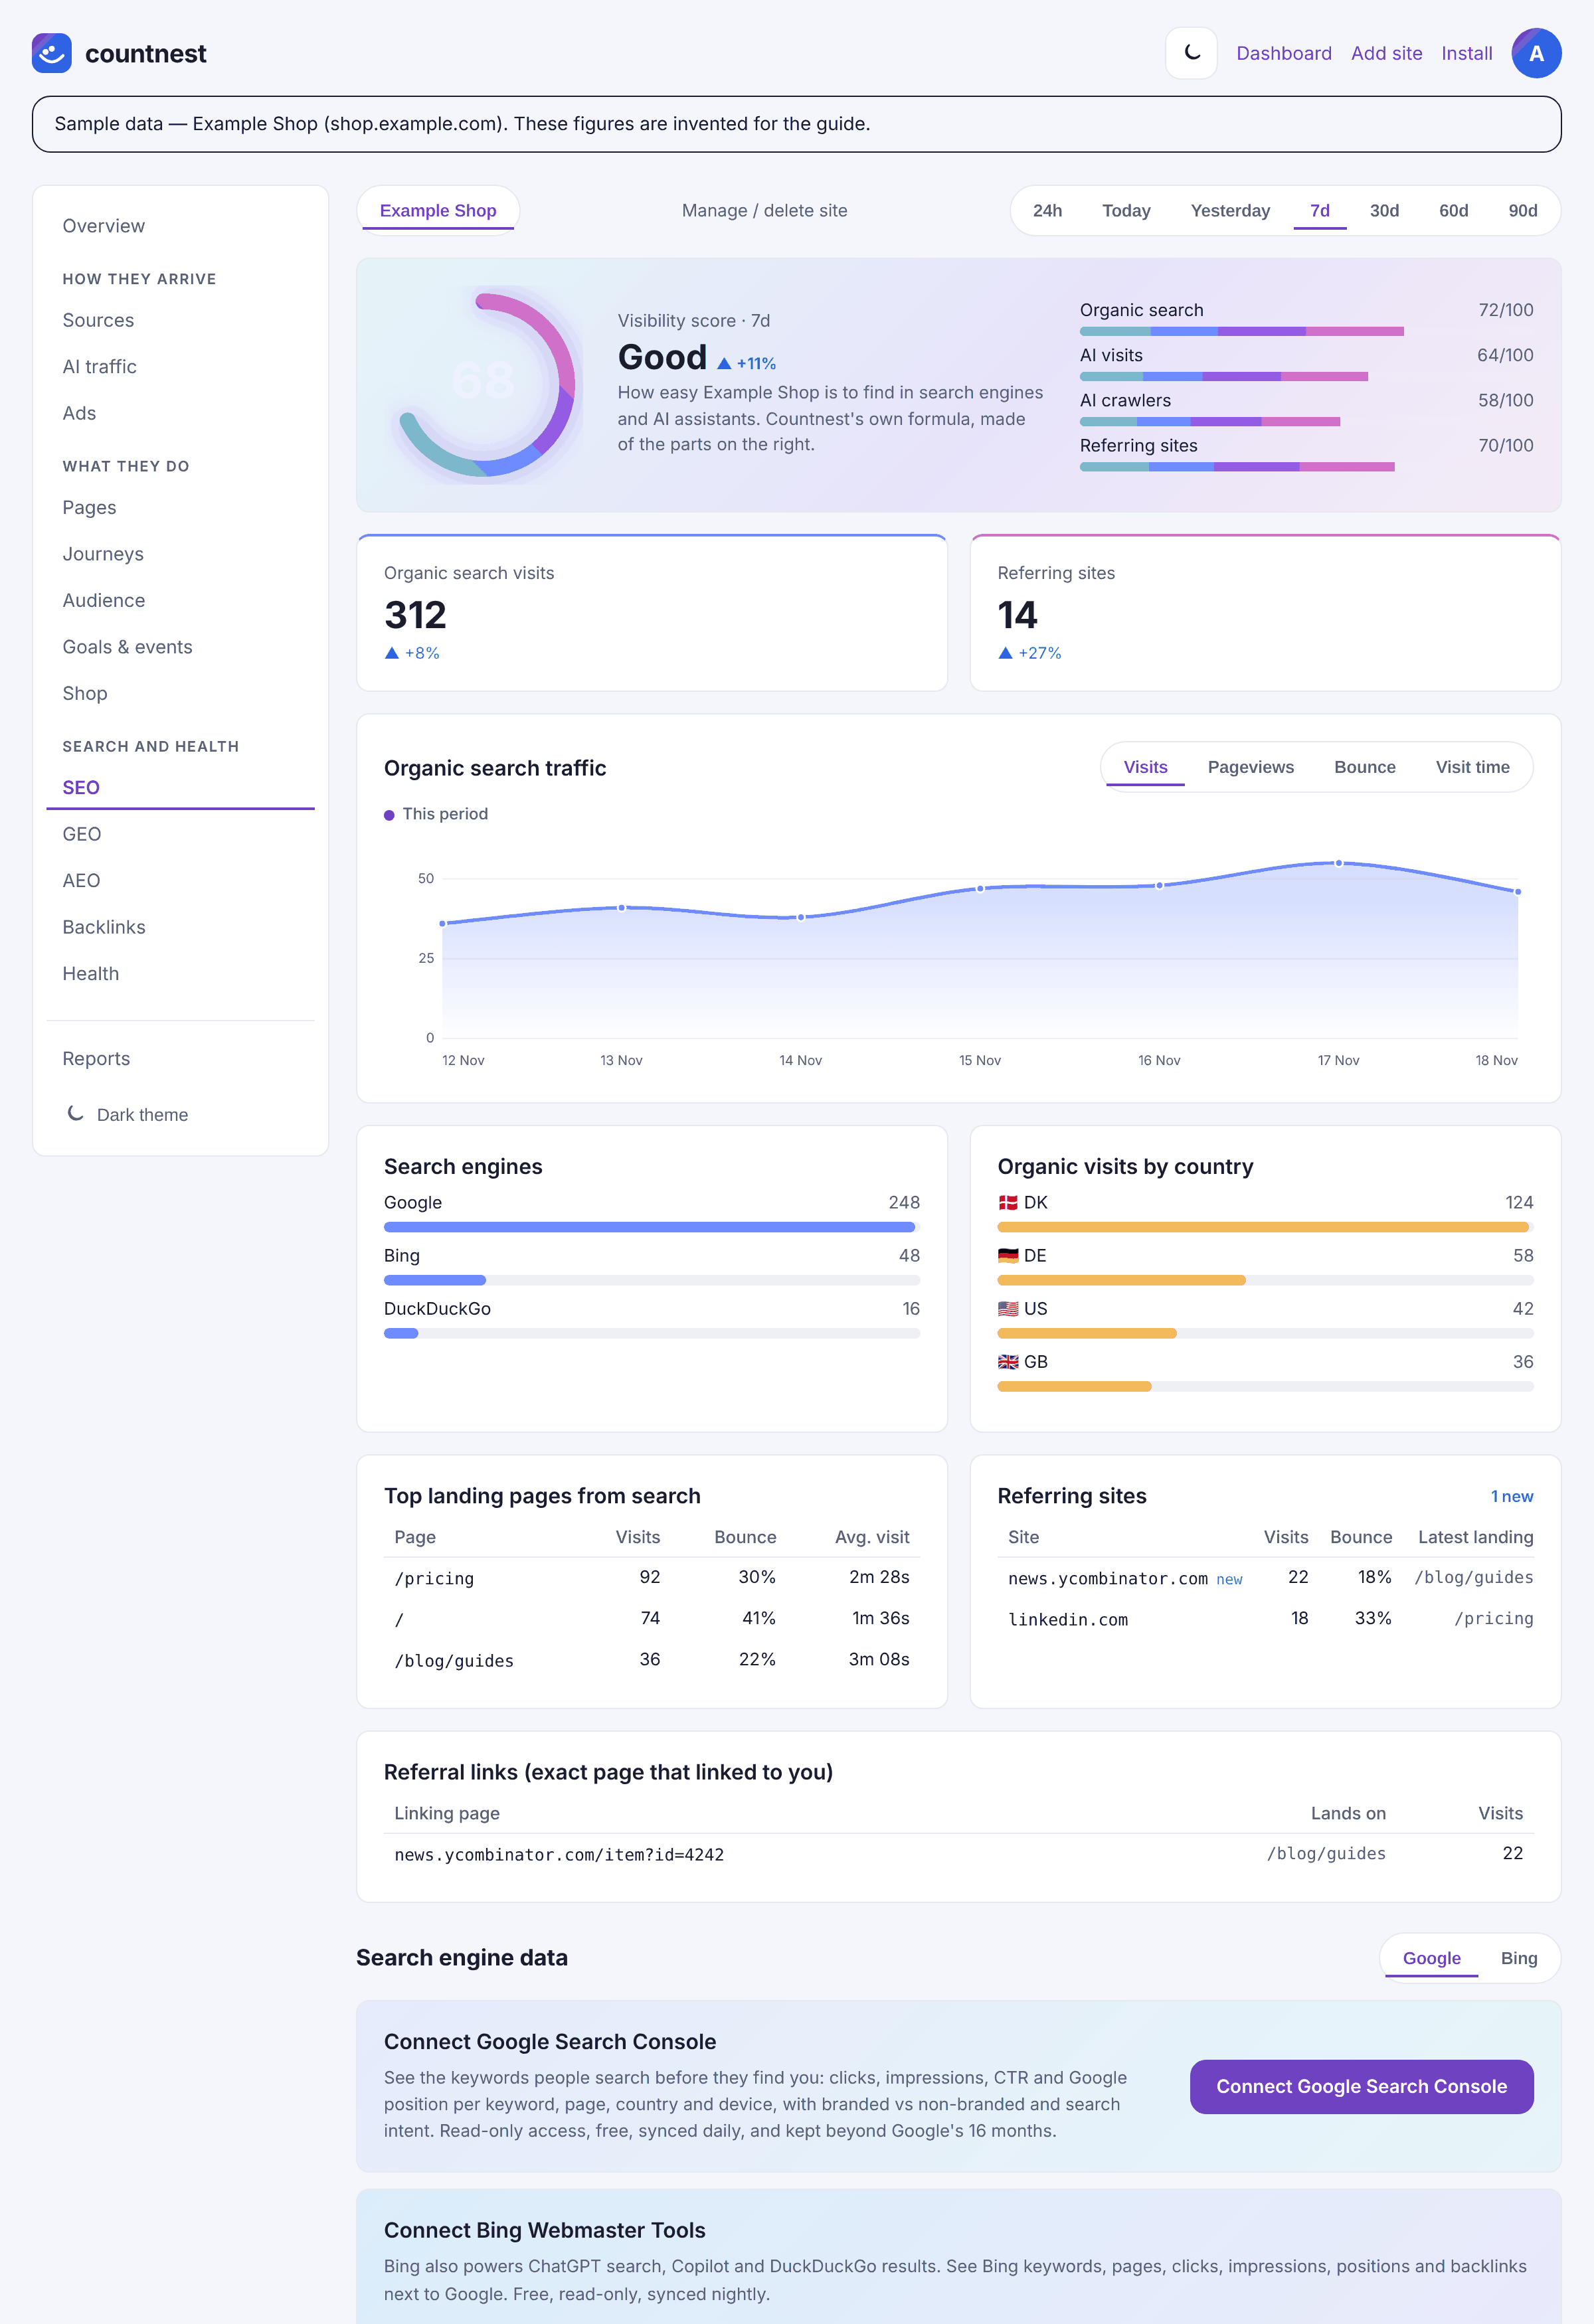
Sample data in the Countnest dashboard (light theme).


Part 4: run both for a week and compare (1 minute now)
Step 9: Mark the switch date
On the Overview tab, under the Visitors chart, click + Add note, keep today's date, type something like
Added Countnest next to GA4, and click Save note. The note stays on the chart, so later you can see where Countnest's history begins.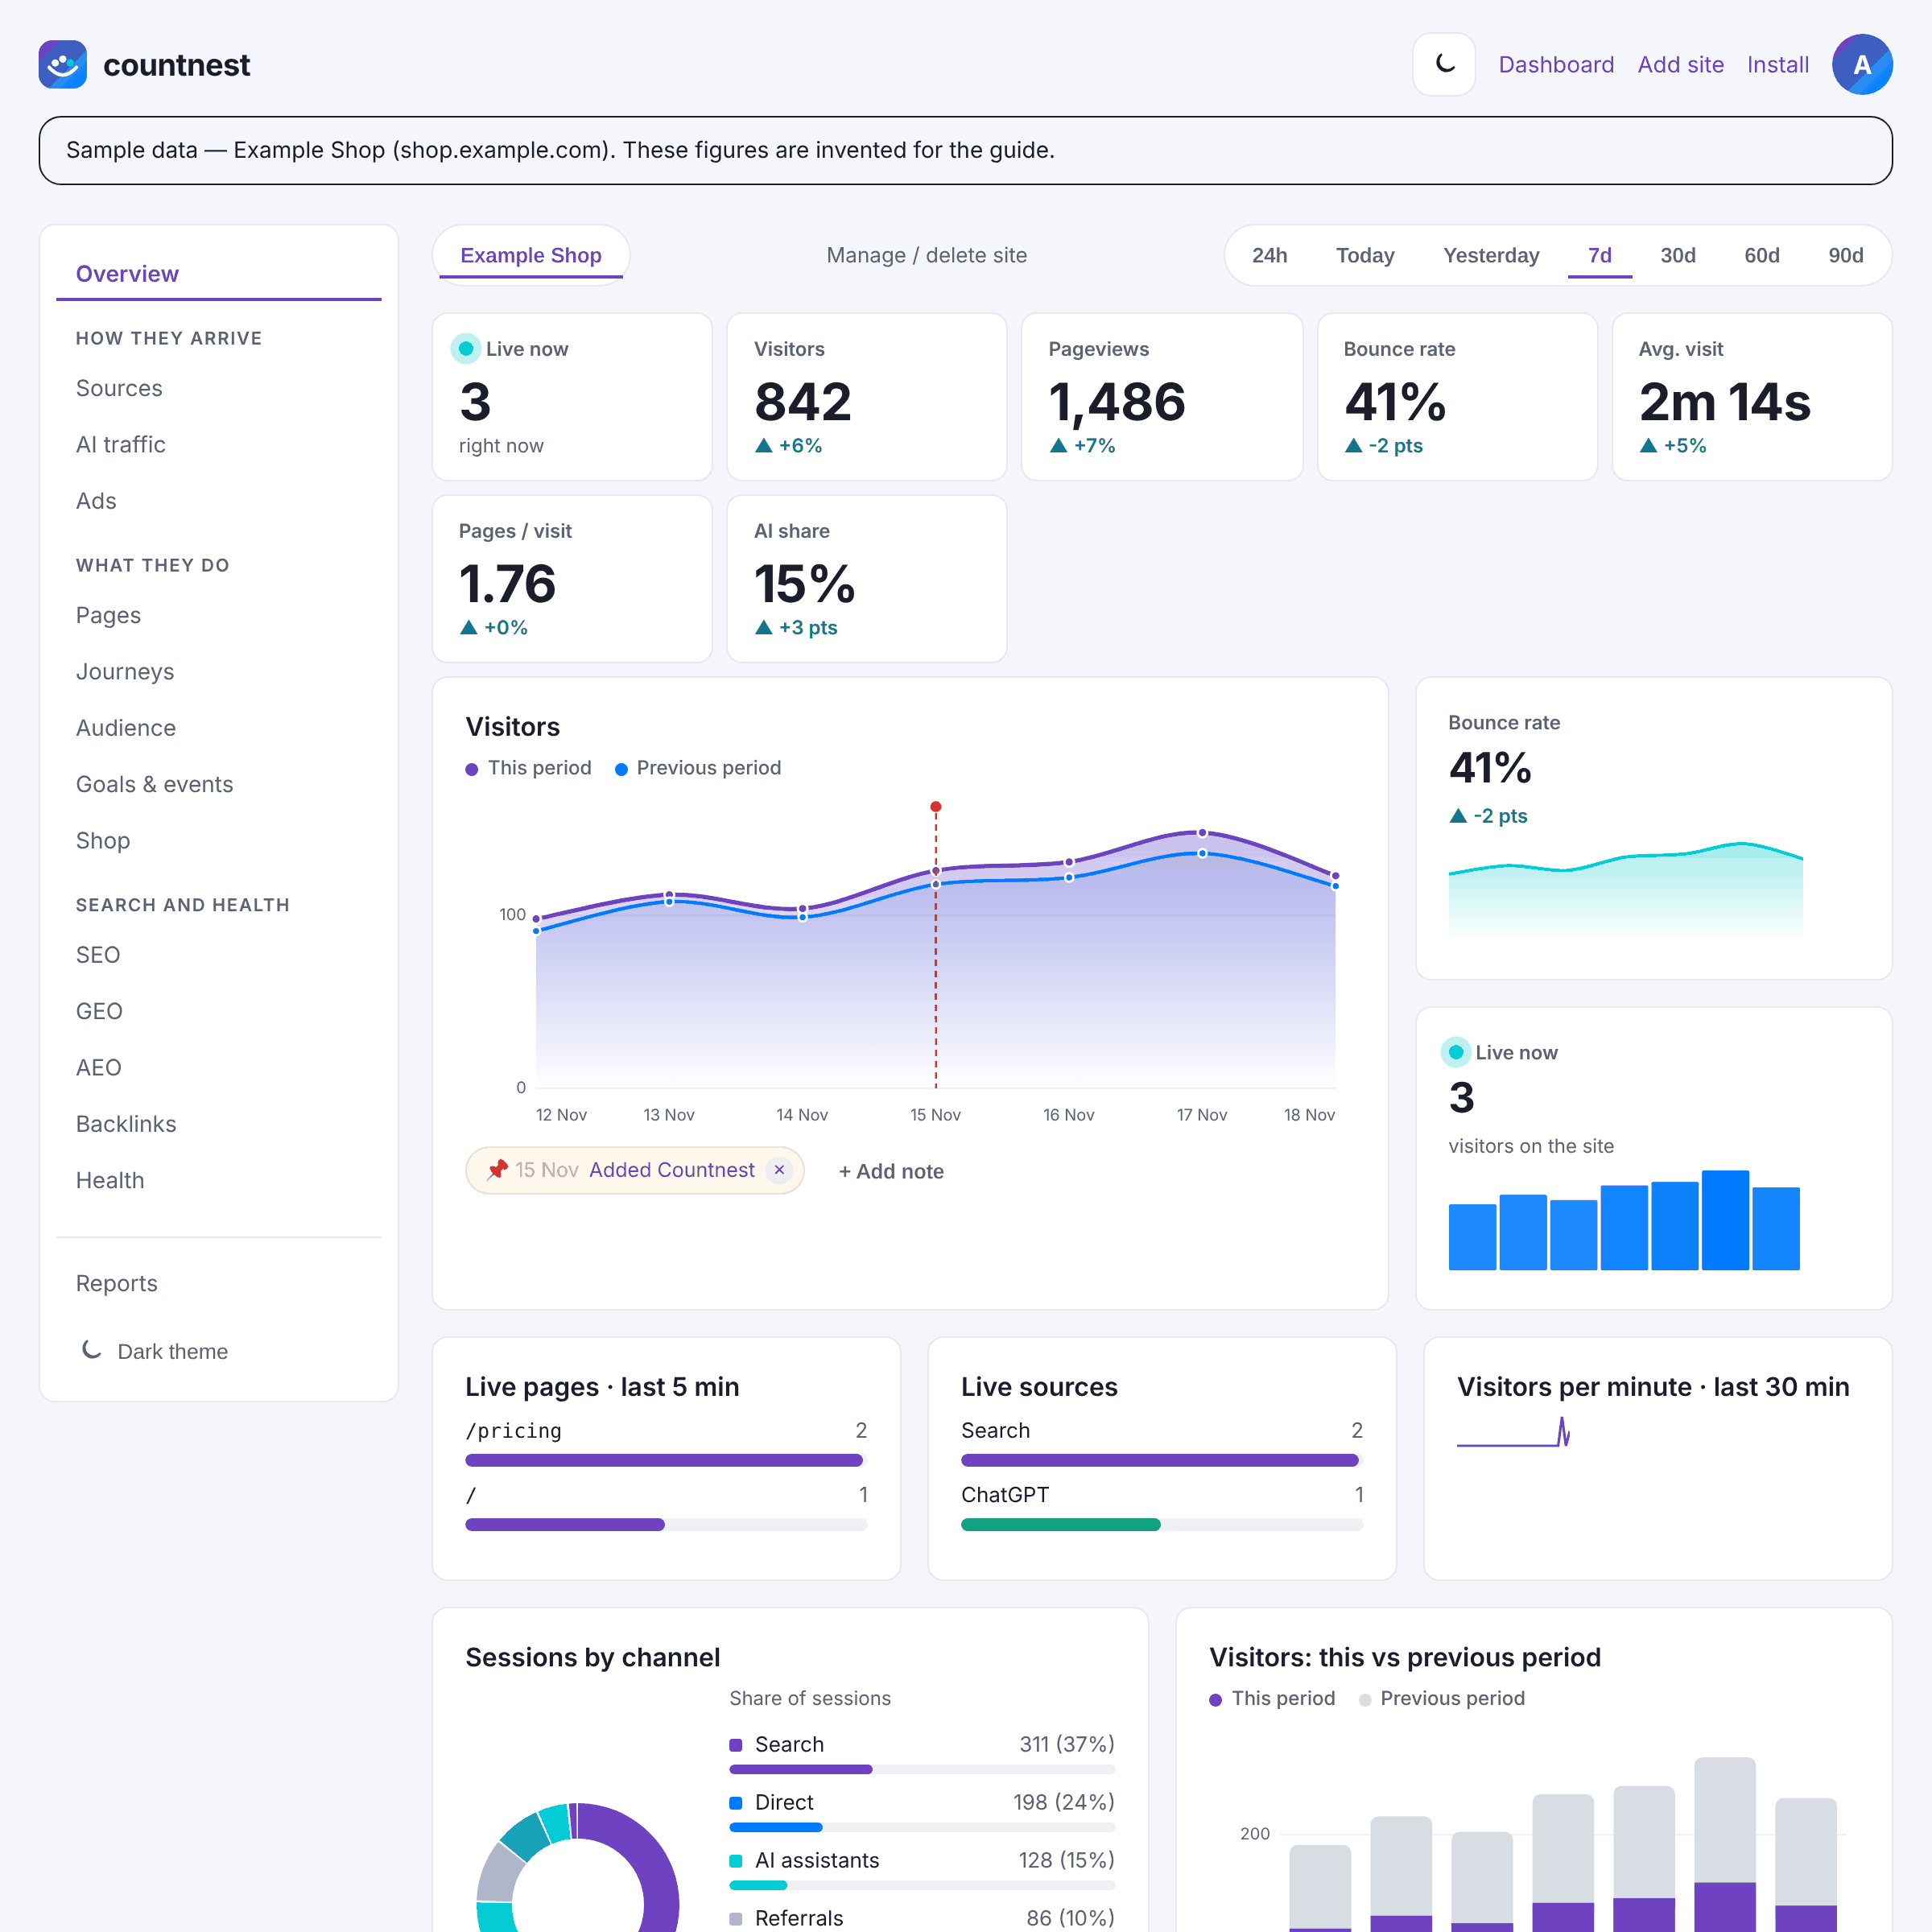
Sample data in the Countnest dashboard (light theme). Step 10: Compare trends, not exact numbers
After a week, pick 7d in Countnest and set GA4 to the same days, in the same time zone. Compare the shape of the daily curve, the top 10 pages and the top sources. If the curves rise and fall together and the same pages and sources lead, Countnest is counting correctly, even when the totals differ. The section why the numbers differ explains the usual gaps.
Sample data in the Countnest dashboard (light theme).

Part 5: remove GA4 safely (5 minutes)
Step 11: Remove or pause the GA4 tag
If GA4 is in your page code: find the Google tag block that loads
gtag.jswith yourG-Measurement ID and delete the whole block, on every page or once in a shared template. If GA4 runs through Google Tag Manager: open Tags, open each Google tag or GA4 event tag, click the 3-dot icon and select Pause (or delete the tag), click Save, then click Submit and Publish. Google says paused tags only take effect after you publish. If GA4 was the container's only job, you can remove the container snippet from your site as well. On WordPress, deactivate the plugin that added GA4. Also check any "custom code" setting in your site builder, then clear your site's cache.Step 12: Check that GA4 is gone
Run your homepage through the free third-party tracker checker. It recognises Google Analytics, the Google tag (gtag.js) and Google Tag Manager: Countnest should be listed and GA4 should not. Scripts added later by a tag manager or after a consent choice cannot be seen by the scan, so also open your browser's developer tools, go to the Network tab, reload the page and filter for
google-analyticsandgoogletagmanager.Step 13: Update your privacy notice and consent banner
Remove Google Analytics from your privacy policy and from your consent banner's list of services, and describe Countnest instead: the provider (IDCPH ApS, Denmark), what is counted and that data is stored in the EU (Frankfurt). Our Data Processing Agreement and privacy explainer give you the details. Whether you still need a banner is a separate question; see the note on consent below.
Step 14: Decide what to do with the GA4 property
You can simply leave the property: with no tag on the site it stops collecting, and your old standard reports stay readable. If you want it gone, export first, then in GA4 go to Admin, under Property click Property details and click Move to Trash Can (Editor role needed). Google keeps trashed properties for 35 days, during which you can restore them, then deletes them permanently. Deleting a single data stream cannot be undone. A data-deletion request is a different tool: it erases the text of chosen event parameters, not the whole property.
Why the numbers differ
Every analytics tool counts a little differently, so some gap between the totals is normal. These are the usual reasons, with Google's own description for GA4:
| Reason | Google Analytics 4 | Countnest |
|---|---|---|
| Consent banners | If you load GA4 only after consent (Google calls this basic consent mode), visitors who decline are not measured. Advanced consent mode sends pings without analytics identifiers, and GA4 may fill the gap with modelled data, but only if the property collects at least 1,000 events a day with analytics storage denied for 7 days, and has at least 1,000 daily users who consented on at least 7 of the previous 28 days | The script stores nothing on visitors' devices, and many sites run it without a banner. That is why Countnest often shows more visits. Whether you need consent is your decision; see the consent note below |
| Users and visitors | GA4 uses its _ga identifier, which by default lasts 2 years in the browser, to recognise returning users | Visits from the same browser and network are grouped only within one day, so someone who returns tomorrow counts as a new visitor. Over a week, Countnest's visitor count can be higher than GA4's users |
| Bounces | Bounce rate is the share of sessions that were not engaged. Google counts a session as engaged if it lasts longer than 10 seconds, has a key event or has at least 2 page views | Bounce rate is the share of visits with one page view. Expect a higher bounce rate in Countnest for the same traffic |
| Bots | Known bots and spiders are excluded automatically, using Google research and the International Spiders and Bots List maintained by the Interactive Advertising Bureau (IAB). You cannot see how much was excluded | Visits from known bot user agents are dropped. AI crawlers such as GPTBot are listed separately in the GEO tab and never counted as visits |
| Privacy signals | Not covered on the Google pages we read | Browsers that send Do Not Track or Global Privacy Control are not counted at all |
| Ad and tracker blockers | Can block the Google tag | Can block the Countnest script. Neither tool can count a visitor whose browser blocks its script |
Google's own page on sessions and engagement is linked under Sources. If one tool shows a sudden gap the other does not, check that both scripts are on every page, including templates for blog posts and landing pages.
Where to find your GA4 reports in Countnest
GA4 names below come from Google's help pages on reports, dimensions and explorations. Countnest names are the labels you see in the dashboard.
| In GA4 | In Countnest | Good to know |
|---|---|---|
| Reports snapshot | Overview: Visitors, Pageviews, Bounce rate, Avg. visit, Pages / visit and AI share, with the Visitors chart against the previous period | Big numbers first, no report building |
| Realtime | Overview: Live now, Live pages · last 5 min, Live sources, Visitors per minute · last 30 min | |
| Traffic acquisition | Sources: Channels, Referrers (click to see exact pages), Search engines, Social networks, New referrers, Lost referrers | |
| Campaigns (UTM) | Sources: UTM campaigns | Your tagged links keep working |
| AI Assistant channel | AI traffic: 17 assistants each on their own row, AI landing pages, AI vs Search: visit quality | See how to track AI traffic |
| Pages and screens, landing pages | Pages: Top pages, Entry pages, Exit pages, Engaged time and scroll per page, Scroll depth | |
| Events (enhanced measurement) | Goals & events: Outbound link clicks, File downloads, Form submissions, Site search | Recorded automatically |
| Key events | Goals & events: Goals (click Add goal) | Conversion rate per source and per AI assistant |
| Funnel exploration | Goals & events: Funnels | |
| Path exploration | Journeys: Visit journeys and Most common paths | Grouped paths, not one person's path |
| Country, city, language, device and browser | Audience: Visitors by country, Countries, Cities, Languages, Devices, Browsers, Operating systems, Screen sizes | Rough location only, never an IP address. No age, gender or interests |
| Search Console reports | SEO: Connect Google Search Console and Connect Bing Webmaster Tools | Search data from both engines side by side |
| Google Ads links | Ads: Campaigns, Import ad costs | No bidding signals or audiences |
| Ecommerce purchases | Shop: Revenue, Orders, Revenue by source, Top products, Checkout funnel | WooCommerce, or any shop that sends a purchase event with a value |
| Share this report, Data API | Reports: Export CSV, Stats API and MCP | The API is on Growth and Agency plans, and during the trial |
| Explorations, Audiences, BigQuery export | Not offered | Keep GA4 if you rely on them |
How Countnest counts visits
This is the main difference you will notice after the switch. Google's cookie usage page says GA4's JavaScript tags use first-party cookies to tell users and sessions apart, and Google says Google Analytics does not log or store IP addresses. Countnest works differently:
- It never saves IP addresses. The IP address is read in memory to form a one-way code that changes daily, and is then discarded.
- Its script does not set cookies or use local storage, and stores nothing on visitors' devices.
- On the same day, visits from the same browser and network can still be grouped, so the records are pseudonymous rather than strictly anonymous.
- Browsers that send Do Not Track or Global Privacy Control are not counted at all.
- Data is stored in the EU (Frankfurt).
More detail is on our privacy explainer.
A note on consent
Whether you need a consent banner depends on your country and on what a tool does, for example whether it stores or reads information on the device, stores IP addresses or records sessions. No tool can promise that you never need consent, and switching tools does not settle that question on its own. This is general information, not legal advice. Official sources: the ePrivacy Directive (2002/58/EC), the GDPR (2016/679) and the EDPB Guidelines 2/2023 on the technical scope of Art. 5(3) ePrivacy. Our overviews: Do I need a consent banner for website analytics? and consent rules in Europe, country by country.
What it costs after the trial
GA4 is free. Countnest has no free plan. After the 30-day trial you choose Starter at $14 a month (1 site, 20,000 sessions), Growth at $29 (5 sites, 100,000 sessions) or Agency at $79 (25 sites, 500,000 sessions), VAT included, with about 2 months free on yearly billing. Every plan has every analytics report. If you do nothing, the trial simply ends. See pricing.
Free tools that help with the switch
- Third-party tracker checker: confirm that GA4, the Google tag and Google Tag Manager are gone and Countnest is running.
- UTM link builder: tag new campaign links consistently from day one.
- AI readiness checker: see which AI and search crawlers your robots.txt allows.
How we checked
On 19 November 2026 we read Google's help pages on data retention, sharing and exporting reports, BigQuery export and its setup, consent mode and behavioural modelling, known bot-traffic exclusion, engagement and bounce rate, enhanced measurement, cookie usage, finding the Google tag, deleting and restoring properties, data-deletion requests, and Tag Manager's pause and publishing pages, plus W3Techs' usage report (all listed under Sources). The Countnest steps follow the labels in the Countnest app on the same day. We did not test GA4 exports inside a live property for this guide, so we describe them as Google does. Google Analytics is a trademark of Google LLC. Countnest is not affiliated with or endorsed by Google. If something here is out of date, tell us at support@countnest.com and we will fix it.
Questions and answers
Can I import my Google Analytics history into Countnest?
No. Countnest has no Google Analytics importer, so its reports start on the day you add the script. Export the GA4 reports you want to keep first (Share this report, then Download File), or simply keep the GA4 property: Google says the retention setting does not affect standard aggregated reports.
Can GA4 and Countnest run on the same site?
Yes. They use separate scripts and do not conflict. We suggest about a week side by side, then compare trends, top pages and top sources before you remove the GA4 tag.
Why does Countnest show more visitors than GA4?
Usually because of consent and counting rules. Where GA4 runs only after consent, visitors who decline are not measured. Countnest stores nothing on devices and groups visits only within one day, so a person who returns on another day counts again. Bot filtering and ad blockers also differ.
How do I remove GA4 from Google Tag Manager?
Open Tags, open the Google tag and any GA4 event tags, click the 3-dot icon and choose Pause, or delete the tags. Click Save, then Submit and Publish. Google says changes only take effect after you publish.
What happens to my data if I delete the GA4 property?
Google moves it to the Trash for 35 days, during which an Editor can restore it. After that it is deleted permanently. Export what you want to keep first.
Is Countnest a free Google Analytics alternative?
No. Countnest has a 30-day free trial with no card, then plans from $14 a month (Starter), $29 (Growth) and $79 (Agency), VAT included. For free options, see our comparison of 10 Google Analytics alternatives.
How long does the switch take?
About 30 minutes of hands-on work: 10 to prepare and export in GA4, 5 to add Countnest, 5 to rebuild goals and links, and 5 to remove GA4 after the side-by-side week.
30-day free trial, no card required. Then from $14 a month. Cancel anytime.
Start free for 30 daysSources
- Google Analytics Help: Data retention (2 or 14 months; only affects explorations and funnel reports; checked 19 November 2026)
- Google Analytics Help: Share & export reports (Download File, CSV, PDF, Google Sheets, 100,000 rows)
- Google Analytics Help: BigQuery Export (daily and streaming export, 1 million events a day on standard properties)
- Google Analytics Help: Set up BigQuery Export (data flows within 24 hours of linking, sandbox limits)
- Google Analytics Help: Consent mode on websites and mobile apps (basic and advanced, IP addresses not stored)
- Google Analytics Help: Behavioral modeling for consent mode (eligibility thresholds)
- Google Analytics Help: Known bot-traffic exclusion
- Google Analytics Help: Engagement rate and bounce rate (engaged session definition)
- Google Analytics Help: Enhanced measurement events
- Google Analytics Help: Cookie usage on websites (_ga, 2 years)
- Google Analytics Help: Find your Google tag ID (Measurement ID starting with G-)
- Google Analytics Help: Edit / delete accounts, properties, and data streams
- Google Analytics Help: Delete or restore accounts and properties (35 days in the Trash)
- Google Analytics Help: Data-deletion requests
- Google Analytics Help: Overview of Google Analytics reports (Reports snapshot, Realtime)
- Google Analytics Help: Funnel exploration
- Google Analytics Help: Path exploration
- Tag Manager Help: Pause tags
- Tag Manager Help: Publishing, versions, and approvals
- W3Techs: Usage statistics of traffic analysis tools (19 November 2026)
- Countnest pricing
- Countnest install docs